New product development to diagnose choice
Dynata integrate realistic augmented reality (AR) stimuli into online surveys to deliver new product research at quantitative scale. Results from this new product development (NPD) consumer research on coffee machines applies real-time behavioural data to panel questions to deliver richer insights which predict and diagnose consumer choice.
Product research challenge
Dynata (the world’s largest first-party data and insights platform) recognise the uncomfortable truth that consumers don’t do what they say. Asking people to self-report their preferences after seeing 2D images of products in surveys is one of the reasons that only 15% of new product launches succeed in the market. The challenge in reducing the Say-Do gap is hindered by flat 2D stimulus (including ‘3D’ screen-based versions) which don’t look or behave like physical products in real world context. Physical prototypes are ideal but take time and resources to produce and, ultimately, lack quantitative consumer insight to make confident decisions.
This industry challenge is amplified when validating complex packaging design changes as well as durable products with intricate UX/UI functionality. FMCG/CPG pack tests require consumer insight on artwork, shape, recycling information, labelling regulations and unboxing experiences. Home appliances, medical and electronic products often need detailed UX/UI testing which can’t be conducted quickly or with quantitative data insight. For both, the challenge is to provide research respondents with products which they can see in real world context and interact with as they would with the real product.
Product innovation
Hindered by flat 2D screen-based images of 3D products and pack designs as well as the time and cost associated with physical prototypes.
Consumer research
Limited to self-reporting on 2D images which aren’t in real world context and don’t capture observational data insight (the Say-Do gap).
Quantitative data
Insight to inform robust business decisions is a challenge when developing new products and pack designs for real world consumption.
Augmented Reality solution
Dynata wanted to publish results not usually possible due to confidentiality restrictions on commercially sensitive new product development (NPD) client projects. Augmented Reality (AR) delivers realistic 3D product prototypes which respondents can see in their home environment using a smartphone or tablet. They automatically interact with AR products as if they’re real products; placing different products on kitchen counters, viewing designs from various angles and moving closer to explore product features.
Studies show that AR products are over 400% more realistic than 2D screen-based images and this new type of stimulus was easily be integrated into Dynata’s quantitative panel surveys. After three years of development, Gorilla in the room’s Product Innovation Platform captures a rich source of data on the behaviours and interactions respondents have with AR products. System 1 technology analyses real-time behaviour using AI to interpret thousands of data points to predict and – importantly – diagnose consumer preferences and choices.
AR products
Enable panel respondents to see realistic 3D products in the real world and interact with design features as if the products are in the room with them.
Real-time behaviour
Captured with behavioural science technology analysing movements and interactions with AR products using AI to interpret millions of data points.
Agile mobile panels
Quickly scale new product innovations to quantitative samples allowing brands to accelerate product innovation and respond to market demands.
Research method and approach
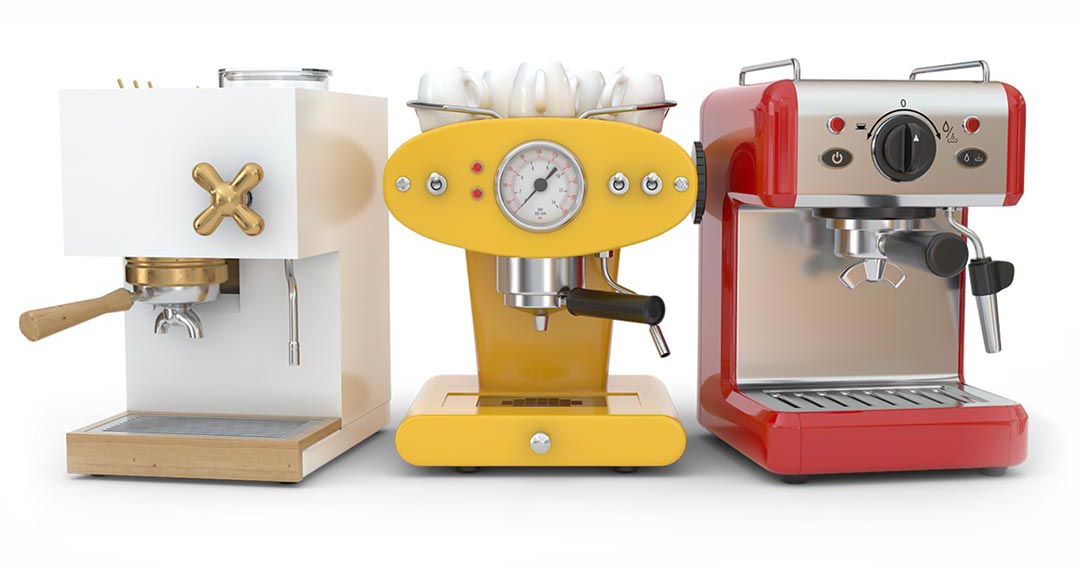
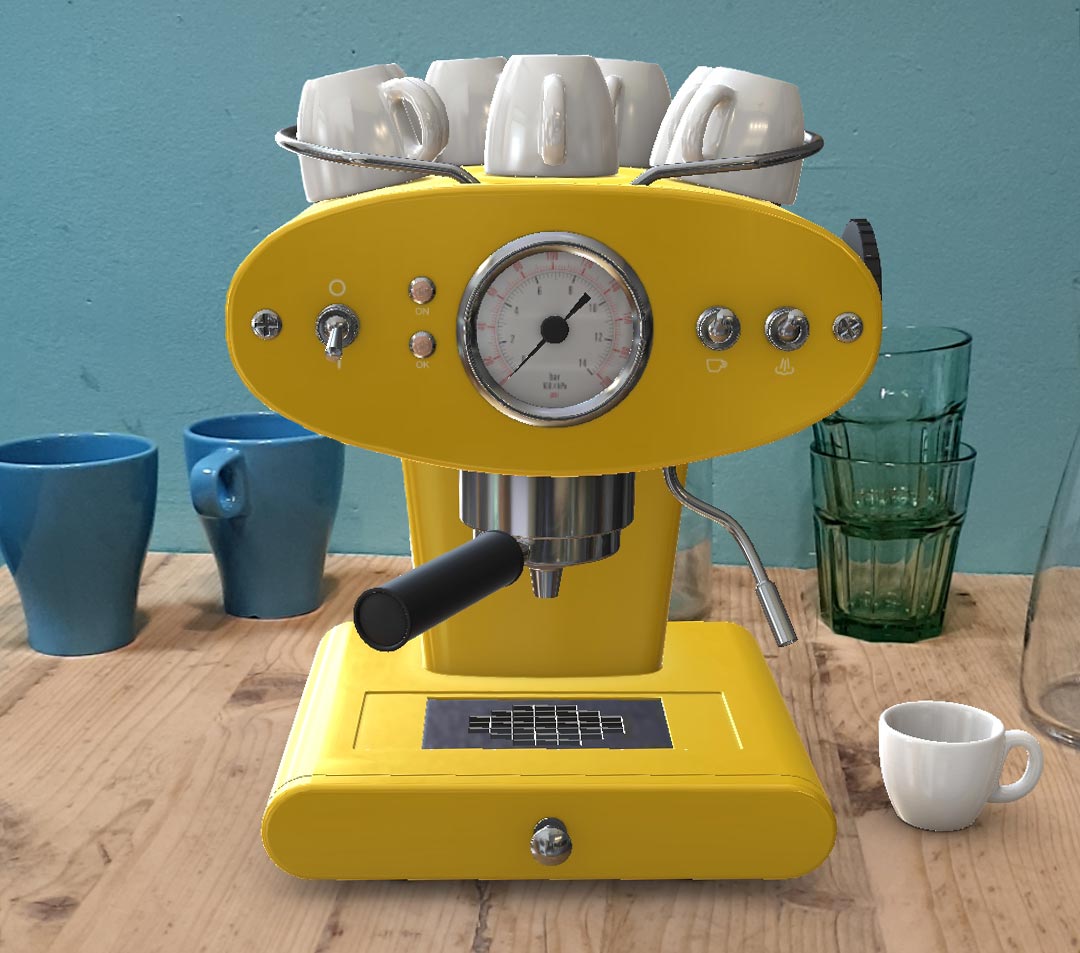
Three AR coffee machines were created as most people are familiar with these products and they represent the range of product categories using AR products in consumer research, from durable goods in the FMCG/CPG sector to non-durable products in Home Appliances, Electronics and Medical sectors. Dynata recruited respondents in the UK who saw three different coffee machine designs. Respondents were asked to spend time exploring each product in their home, viewing them from different angles and investigating their features before stating which one they would buy. They were told that the cost of each product would be similar. Finally, we asked respondents to report their experience using AR in research studies.
AR stimulus
Integrated into standard online survey for research respondents to see and explore coffee machines in their home as they would with a physical prototype.
Observed data
Data combined with traditional survey questions to predict and diagnose choice based on reported and observed data insight.
Mobile panel
Exposed to three new coffee machine designs with real-time behavioural data measuring observed natural behaviours with products in real world context.
Results and recommendations
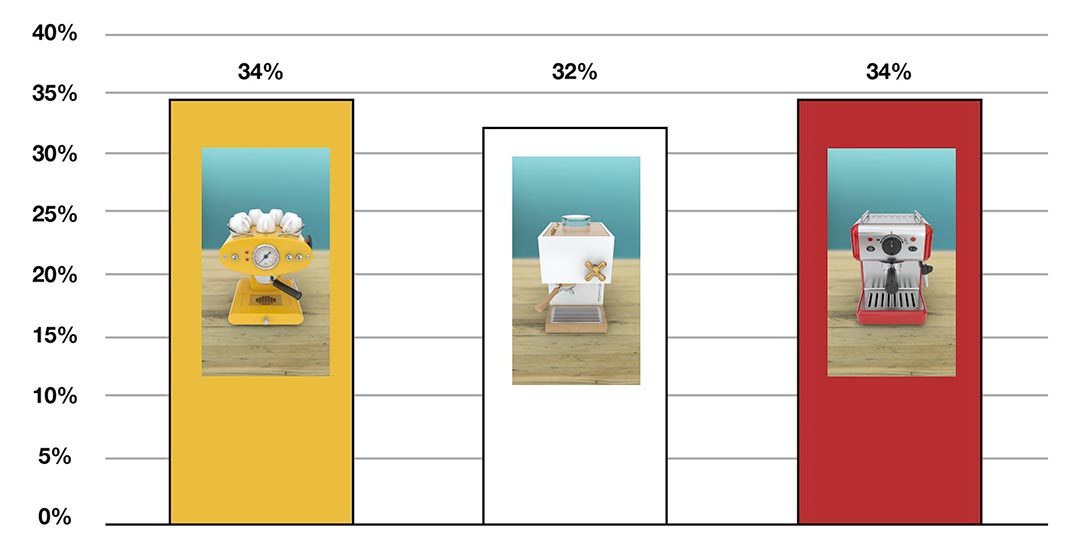
The traditional survey questionnaire response (above) showed no preference between the different coffee machines, with similar scores across the three variants, which isn’t uncommon in survey results using traditional methods. Behavioural data, however, revealed rich insight to deliver two advancements in consumer research. Firstly, observational data enabled diagnosis on why respondent decisions had been made to inform the different choices behind each product. Secondly, comparing data on which products were rejected and accepted, System 1 insight showed that respondents behaved differently towards the machines they accepted compared to the ones they rejected.
Interpretation of complex behavioural data sets (and client feedback) identified metrics which the industry find valuable to inform decisions:
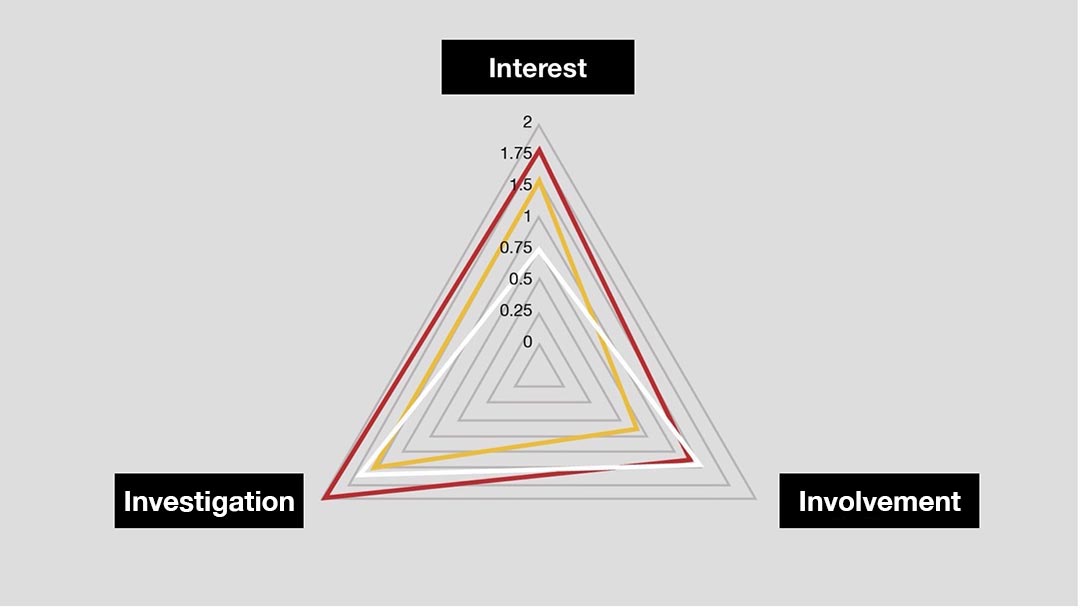
Interest
Measures whether people made an effort to study the product and this showed that respondents gave significantly more attention to the red coffee machine compared to the other two.
Involvement
Captures their motivation to understand more about the product and this highlighted higher engagement with both the red and white coffee machines compared to the yellow product.
Investigation
Analyses whether people explored every aspect of the product with respondents motivated to examine the red coffee machine much more than the other two.
Yellow coffee machine
This was engaged with the least so respondents chose not to interact with this product in order to understand it. It was easily understood by respondents and decisions were based on respondents’ initial views. Respondents based their choice more on the initial features of the design rather than the function. Put simply, this was chosen or rejected on aesthetic appeal which can, of course, be polarising.
Appeal Score = 0.9
Conclusion: a product which was accepted or rejected based on style.
White coffee machine
This product generated the least interest but scored high on involvement so respondents were motivated to understand it and were able to quickly accept or reject it. Respondents could understand this product’s appeal and accepted or rejected it more quickly than the others so decisions were made more on intuitive System 1 choices.
Appeal Score = 1.0
Conclusion: a product chosen by those who want something simple and intuitive.
Red coffee machine
This generated the most interest and was also investigated more than the other designs. The product design generated the highest Appeal Score with respondents motivated to understand it’s features before accepting or rejecting. Decisions about this product were made with the greatest degree of confidence.
Appeal Score = 1.1
Conclusion: the optimum product to launch with high consumer confidence and happiness in purchase decision.
Predicting choice
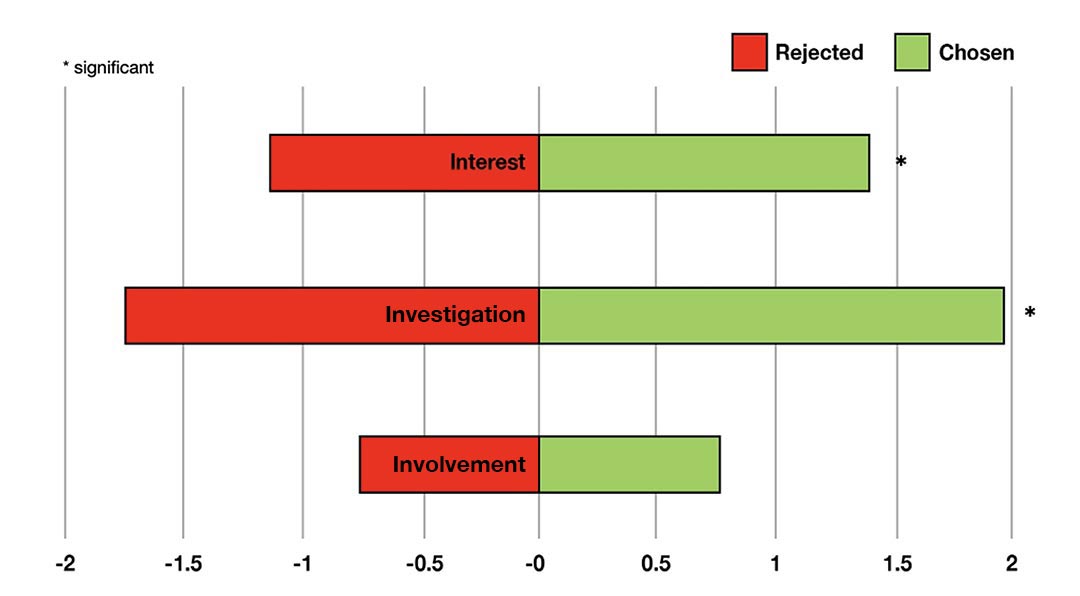
Behavioural analysis comparing data on the products respondents chose (compared to those they rejected) revealed that people were more interested – and investigated their chosen products more – than the products they rejected. This means behavioural data is more predictive of real purchase intent as it shows that respondents were more curious about the products they chose compared to those they rejected.
Augmented Reality
The question “On a scale of 1 to 10 how much would you like to do more surveys involving Augmented Reality” was included at the end of the survey. Respondents rated this 9.0 on average with 98% of people rating this as 6.0 or above. These high scores were also supported by respondent comments on their experience:
“I have actually really enjoyed this much better than a 2D photo of a product and can really get to grips with what it would look like”
Male (25)
“It was really easy to use and rotate the products to get a full reflection of the entire coffee machine would be good for purchasing items online”
Female (52)
“Really great way to review different products”
Male (45)
Augmented Reality is enjoyed by respondents (which corresponds with other studies delivered with clients), it’s a positive inclusion in surveys and respondents want to do more.

Final conclusions
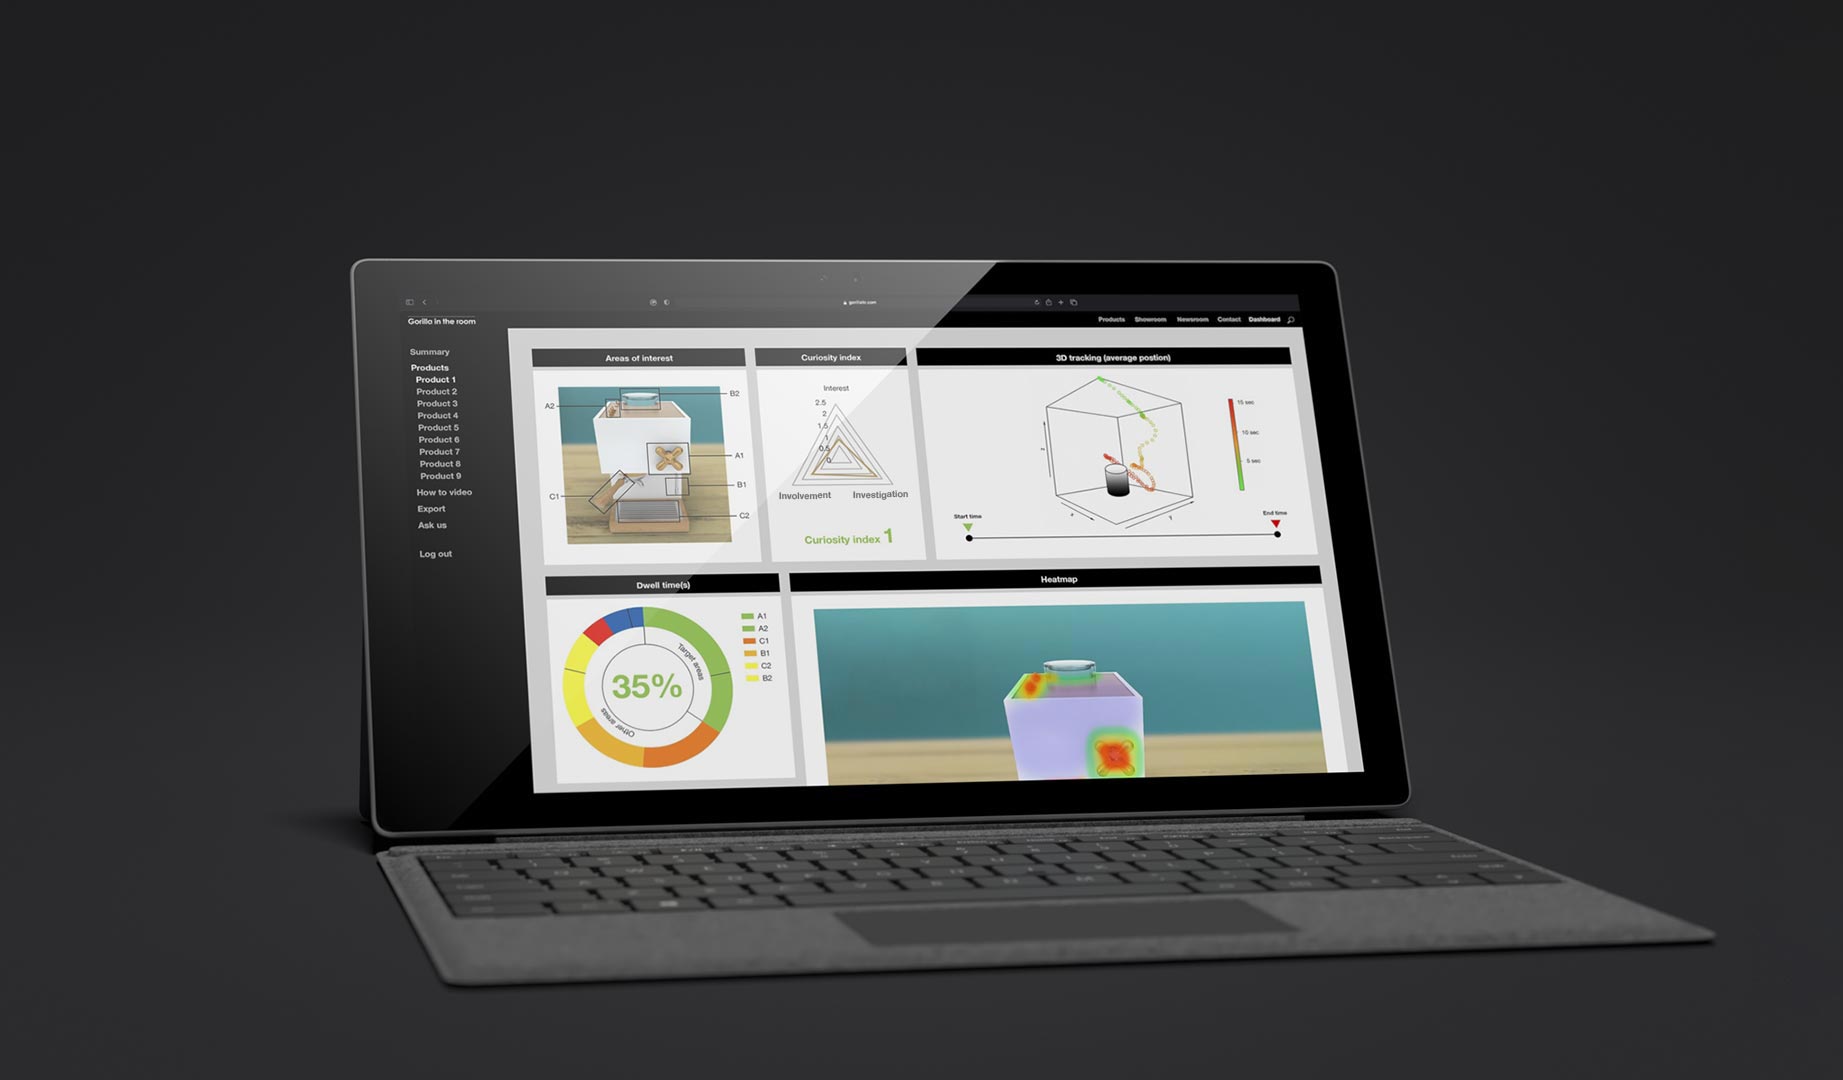
Measuring how people interact with AR products, diagnoses why choices are made and predicts which products people love the most. If this had been a standard survey with direct questions – where the aim had been to select which product to launch – the research would have been inconclusive. Mobile AR products and behavioural insight helped understand the motivation for the different choices to predict which products respondents would choose.
Business impact
The insights from this public case study support client results on our Product Innovation Platform. New product development studies and pack tests in the UK, US, France, Germany, Canada etc have accurately predicted choice and provided clients with a deeper understanding of consumer preferences in order to make confident decisions. One surprising benefit, prior to consumer research, is stakeholders are able to accelerate the product innovation process by quickly aligning internal teams in different locations with one version of the truth. This is therefore helping brands to filter, iterate and select the best product early in the development cycle.
